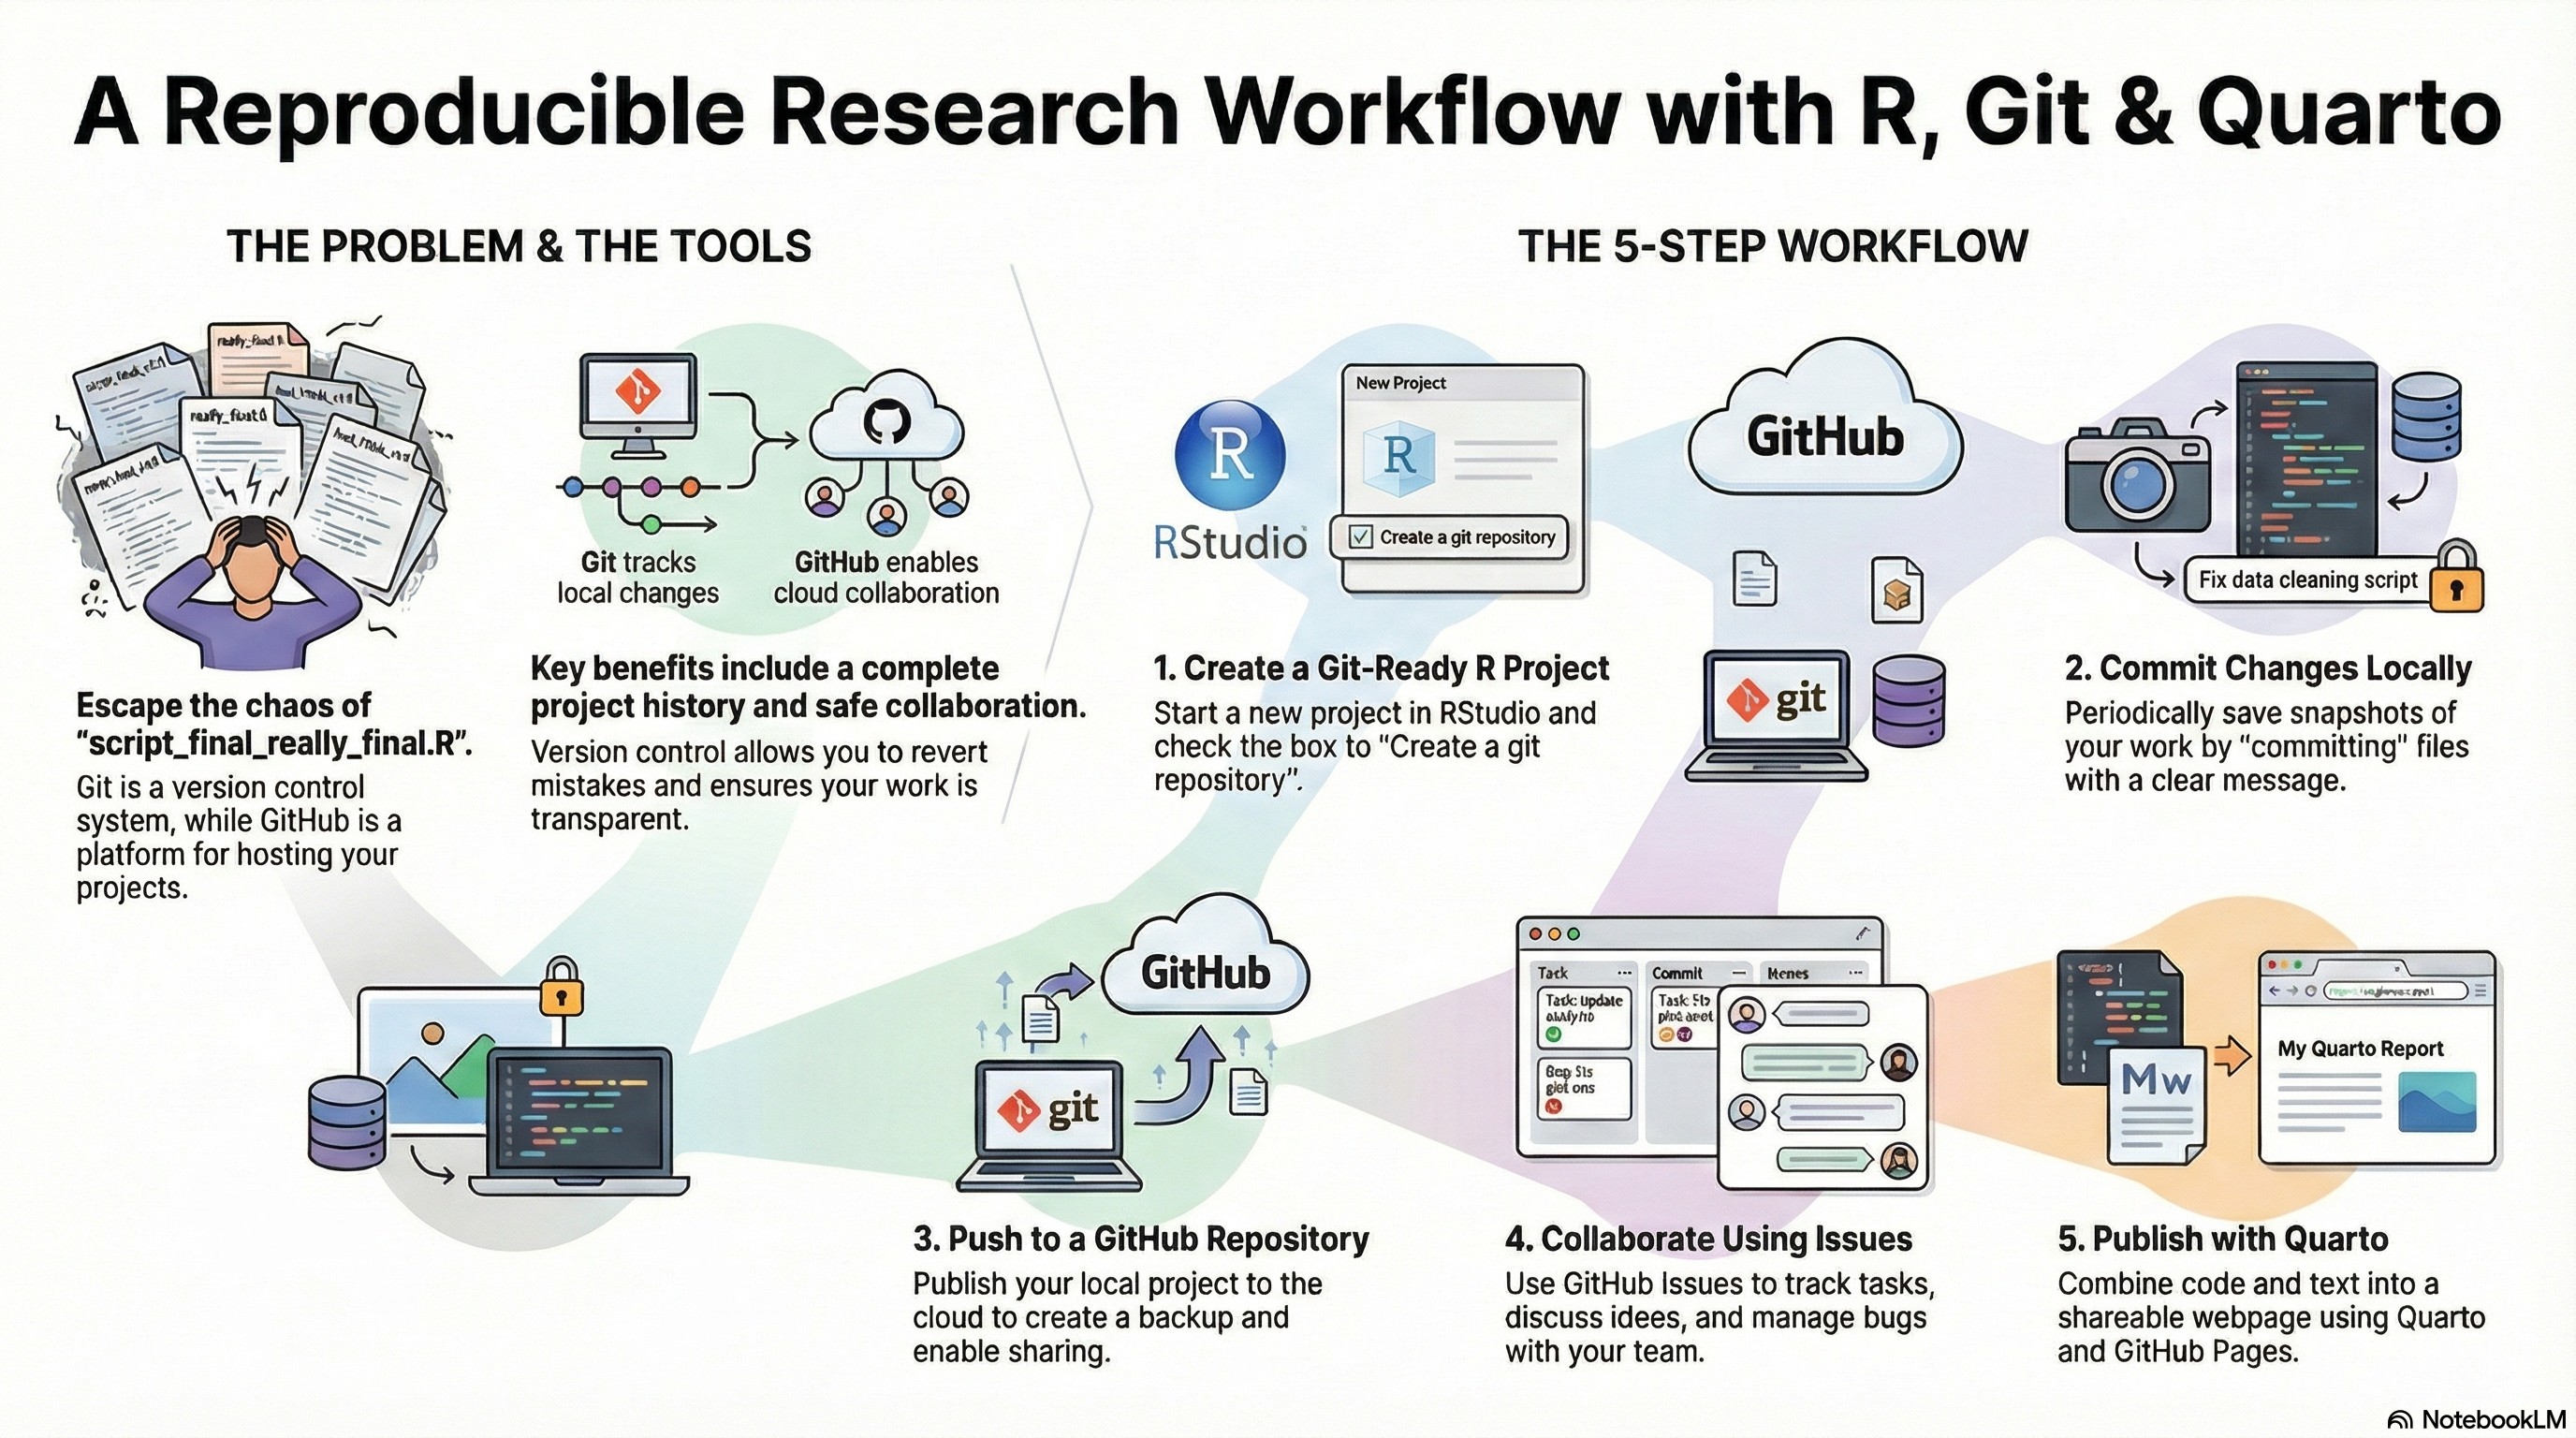
This live session introduces a practical workflow for version control and reproducible reporting using GitHub, R, and Quarto. We will move from local projects to publishable, shareable outputs with a minimal but robust setup.
Who this is for
R users who are new to Git and GitHub
Analysts who want a clean, repeatable workflow for public health projects
Anyone preparing to publish Quarto documents or GitHub Pages sites
What you will learn
Why version control matters for public health data science
How to connect RStudio to GitHub securely
How to structure a project for collaboration and reproducibility
How to use Quarto for reports and websites
How to publish a project using GitHub Pages
Mini-case example for the session
We will use a small, realistic dataset to practice a reproducible workflow from data import to a published report. The example mimics a monthly district summary often used in routine surveillance.
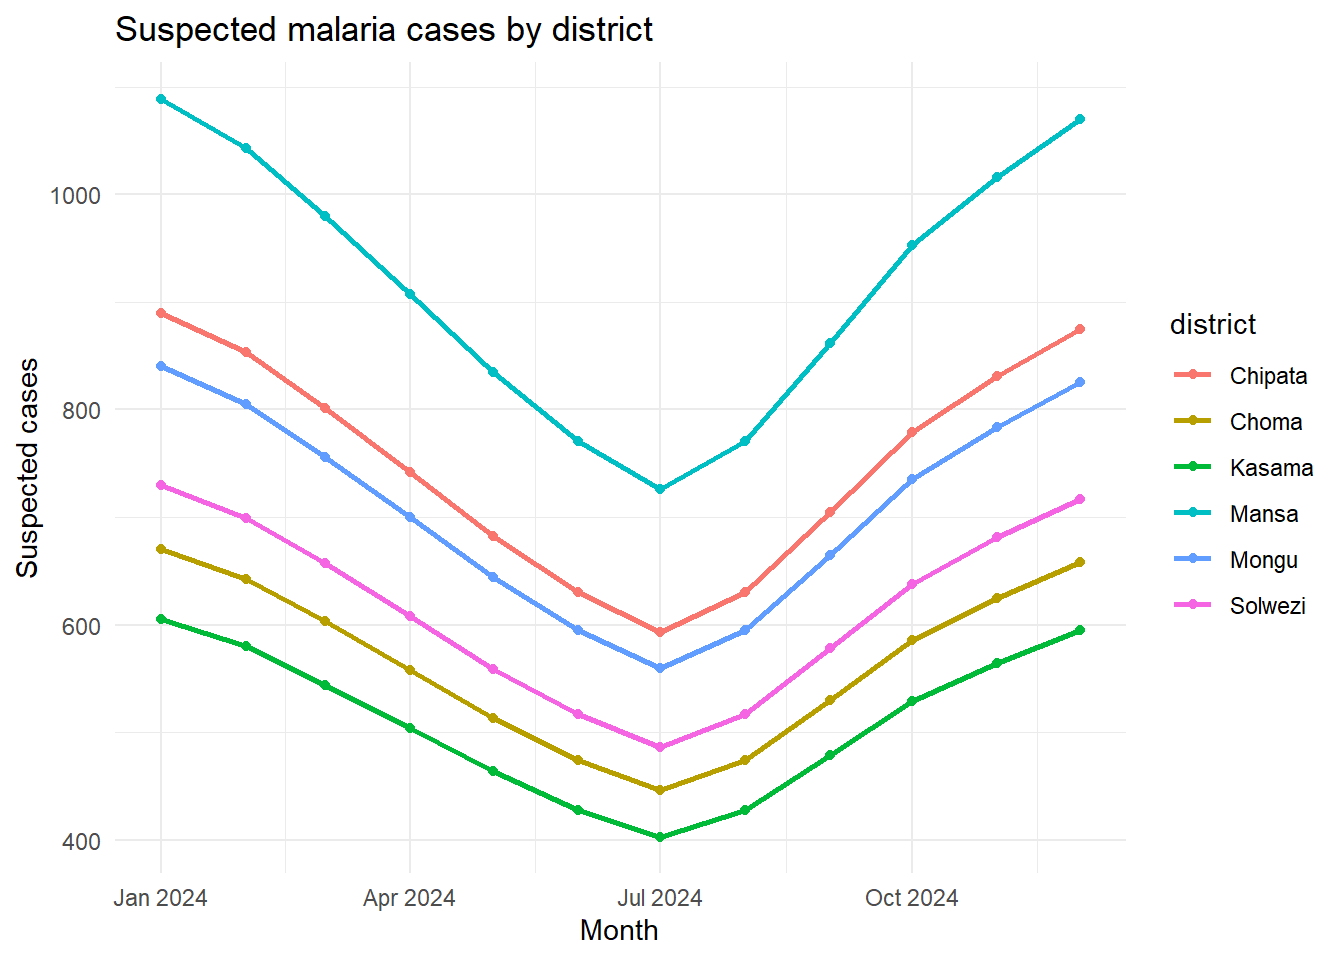
In this mini-case, you are supporting a district review meeting where the program team wants to understand whether recent increases in suspected malaria cases reflect a true rise in transmission or shifts in testing effort. You will compare districts across a few months, calculate positivity, and prepare a short summary that could be shared with colleagues and decision makers.
This is also a gentle introduction to Quarto. If you have not used Quarto before, think of it as a modern, easy way to combine R code, results, and narrative text in a single document. We will use Quarto to turn the analysis into a clean report that can be shared or published online, without copying and pasting output by hand.
You can think of the Quarto workflow in three steps:
Write your analysis and narrative in a single .qmd file
Render to HTML with one command
Publish the output to GitHub Pages
This blog post is being created using the same process, so you can use it as a real example of the workflow we will practice together.
This post uses the same workflow
This post is written in Quarto, rendered to HTML, and published with GitHub Pages. You can follow the exact same steps during the session.
Case question
Which districts show a rise in suspected malaria cases over the last three months, and how do testing numbers affect interpretation?
During the session, we will:
Commit the raw data import
Commit the cleaned dataset with a clear message
Add a Quarto report section with the figure
Publish the report to GitHub Pages
Session outline
Version control concepts in plain language
Git setup and authentication
Creating a new R project with Git
Project structure and .gitignore best practices
First commits and commit messages that tell a story
Pushing to GitHub and working with issues
Building a Quarto document and publishing
Before the session
Please complete the steps below so we can spend the session coding together.
Creating a clear structure early saves time later. It keeps raw data, cleaning scripts, and outputs separated so collaborators can find what they need quickly. It also makes it easier to automate your workflow and reduces the chance of accidentally overwriting files or mixing raw and processed data.
project/
  data/         # raw data files
  scripts/      # R scripts
  outputs/      # cleaned data, figures, models
  local/        # private or sensitive files (ignored)
  README.md
  index.qmd     # Quarto document
Example .gitignore
Use a .gitignore file to tell Git which files should never be tracked. Add it early in the project so you do not accidentally commit large datasets, temporary files, or anything sensitive. You can update .gitignore at any time, but it only affects new changes, so it is best to put it in place before you start adding files.
.Rhistory
.RData
/local/
*.docx
*.tmp
Collaborating with GitHub Issues
Issues are a lightweight way to coordinate work and keep a clear record of decisions. They help teams capture tasks, bugs, and questions in one place so progress is visible to everyone.
Key features to know:
Labels to group work (e.g., bug, data, documentation)
Assignees to show who is responsible for a task
Checklists to break work into steps
References that link issues to commits and pull requests
Good issue hygiene:
Write a clear title and short description
Add context, links, or screenshots when useful
Keep issues focused on one task or decision
To collaborate with others, add them to your repository:
Open the repo on GitHub
Go to Settings → Collaborators and teams
Invite a collaborator by GitHub username or email
Once they accept, they can push changes, open issues, and submit pull requests (depending on permissions).
Example issue template
**Task:** Add data dictionary for malaria routine data

**Why this matters**
- Clarifies variable definitions for collaborators
- Supports reproducibility and handover

**Steps**
- [ ] Draft variable list and descriptions
- [ ] Add to `README.md`
- [ ] Link the issue in the next commit

**Assigned to:** @username
Quarto and publishing
We will create a simple Quarto document and publish it with GitHub Pages.
title:"My First Quarto Document"format: htmleditor: visual
Build the example Quarto document
Create a file called index.qmd in your project root and add a short write-up plus the mini-case R code. Below is a minimal working example you can paste and adapt.
Summary
This report checks recent suspected malaria cases and test positivity across districts.
library(readr)library(dplyr)
Attaching package: 'dplyr'
The following objects are masked from 'package:stats':

    filter, lag
The following objects are masked from 'package:base':

    intersect, setdiff, setequal, union
library(ggplot2)
Warning: package 'ggplot2' was built under R version 4.5.1
library(plotly)
Warning: package 'plotly' was built under R version 4.5.2
Attaching package: 'plotly'
The following object is masked from 'package:ggplot2':

    last_plot
The following object is masked from 'package:stats':

    filter
The following object is masked from 'package:graphics':

    layout
── Column specification ────────────────────────────────────────────────────────
Delimiter: ","
chr  (1): district
dbl  (6): population, under5_population, suspected_cases, tests_done, positi...
date (1): month

ℹ Use `spec()` to retrieve the full column specification for this data.
ℹ Specify the column types or set `show_col_types = FALSE` to quiet this message.
ggplot(case_data, aes(month, suspected_cases, color = district)) +geom_line(linewidth =1) +geom_point() +labs(title ="Suspected malaria cases by district",x ="Month",y ="Suspected cases" ) +theme_minimal()
interactive_plot <-ggplot(case_data, aes(month, suspected_cases, color = district)) +geom_line(linewidth =1) +geom_point() +labs(title ="Suspected malaria cases by district (interactive)",x ="Month",y ="Suspected cases" ) +theme_minimal()plotly::ggplotly(interactive_plot)
Publishing workflow:
#| eval: falseusethis::use_github_pages()
#| eval: falsequarto preview
#| eval: falsequarto publish gh-pages
If you have not installed Plotly before:
#| eval: falseinstall.packages("plotly")
Create a _quarto.yml file
Quarto projects can use a _quarto.yml file in the project root to set site-wide options like the title, theme, and output format. This is especially useful when you want consistent settings across multiple pages or plan to publish with GitHub Pages.
When you create a Quarto Project in RStudio, this file is generated. However, you can also create it manually in any Quarto project by adding a new file named _quarto.yml to the project root.
Beyond a basic report
Quarto and GitHub Pages can publish far more than a static report. Once you are comfortable with the basics, you can explore:
Dashboards for routine monitoring and rapid summaries
Interactive maps for spatial data and intervention targeting
Slide decks for presentations and briefings
Websites for documentation, data dictionaries, and project notes
These options use the same workflow: build your content in Quarto, then publish it with GitHub Pages.
Practice exercises
Create a new R project with Git enabled
Make three commits with descriptive messages
Push to GitHub
Create a Quarto index.qmd and publish to GitHub Pages